- Innovations
- Articles on application of PCI
- Spread Trading
Performance of Japanese stock market versus the US stock market

The relative performance of Japanese stocks compared with US stocks can be easily analyzed by applying the Personal Composite Instrument (PCI) technology based on PQM Method. To get access to PCI technology just download the NetTradeX trading platform and open a demo or real account. After installing the NetTradeX platform, let us create a simple PCI composed of the NIKKEI and the SP500 - the CFDs on the Japanese and the US stock market indices Nikkei 225 and SP500, as the Base and Quote assets respectively. The straightforward steps for PCI creation are described at the webpage “How to create synthetic instrument ”.
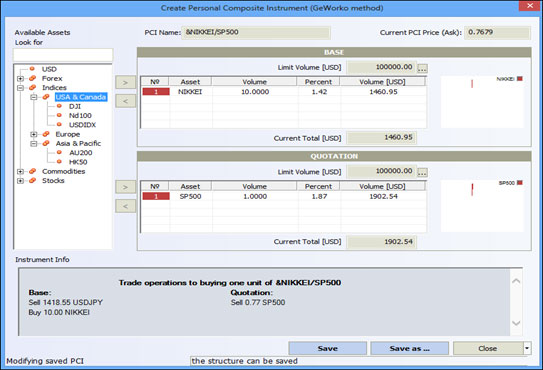
By setting the volume of the base asset NIKKEI equal to 10 and the volume of the quoted asset SP500 as 1 we get the structure of the PCI as shown in the Figure 1 below.

Figure 1: &NIKKEI/SP500 PCI
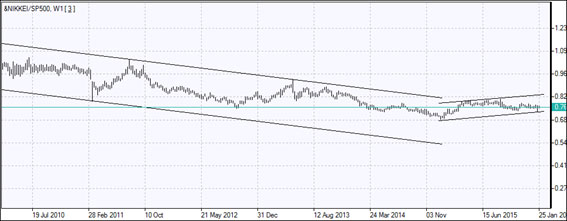
Saving the PCI as &NIKKEI/SP500 and adding the newly created instrument to the list of used instruments allows to open the PCI’s chart and analyze its performance and trade. The chart is presented below in Figure 2.

Figure 2: &NIKKEI/SP500 PCI Weekly Chart
It is the weekly candle chart of the PCI price with trend channels drawn to indicate the direction of price movement. The price of our PCI plotted on the chart is equal to the ratio of the dollar values of 10 Nikkei 225 indexes and the SP500 index. From a visual inspection it is evident the PCI price had been falling in the 2010-2014 period but starting from 2015 an upward trend has been formed. Recalling the structure of our PCI this means the US stock market outperformed the Japanese stock market in the period 2010-2014. However, starting from 2015 the Japanese stock market has been performing better than the US stock market.
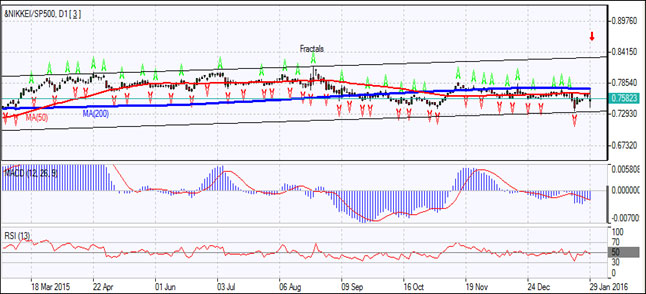
So, the weekly PCI chart shows the Japanese stock market has been outperforming the US equities market since 2015. We can switch to the daily time frame to study closely the price dynamics. The daily candlestick chart, where the Williams’ fractals indicator, 50-day and 200-day Moving Average indicators MA(50) and MA(200), as well as the RSI and MACD indicators are added, is presented below in Figure 3.

Figure 3: &NIKKEI/SP500 PCI Daily Chart
The price is moving within an upward channel on the daily chart. The RSI indicator has crossed above the 50 level but is falling back below it. This is a bearish signal. The MACD indicator is below the zero level and the signal line, and the gap with the signal line is widening. This is a bearish signal. The price has edged up to 50-day Moving Average but didn’t manage to breach it. The 200-day Moving Average is above the 50-day Moving Average which is tilting lower. This is also bearish signal. Looks like bears are in control, which is indicated by the red down-arrow on the PCI chart. If the price declines and bounces back over the lower channel boundary, the current trend will remain intact. However, breaching the channel lower boundary may signal the start of a reversal of the current uptrend. If, on the other hand, price breaches above the 50-day Moving Average and rises further the current uptrend will strengthen. So, these are the signals that should be monitored to determine whether the Japanese stock market will continue outperforming the US stock market.
The flexible PCI technology allows to create a PCI with base and quote portfolios composed of stocks from different stock markets. So, traders can compare relative performances of portfolios made up of different combinations of stocks from markets they are considering for investing to determine which ones present better investment opportunities. It is just a straightforward exercise of assigning volume values to assets after selecting the specific constituents for base and quote portfolios and then studying the performance of the PCI using the multitude of analytical tools available on the NetTradeX platform.
Previous articles
- Comparing the performance of German stock market versus US stock market
- Arbitrage Trading | FCATTLE/SOYB - The Efficiency Analysis
- PCI: Commodity Futures - Coffee vs Cocoa
- PCI on Agricultural Futures: Wheat Futures and Feeder Cattle
- New Corporate Report - Google Stocks, Apple Stocks
- Spread Trading | Stock Trading - Google Stocks, Apple Stocks
