- Innovations
- Articles on application of PCI
- Spread Trading
Arbitrage Trading | FCATTLE/SOYB - The Efficiency Analysis
Good afternoon, dear investors. In this overview we would like to introduce an instrument of spread trading, composed on the basis of two agricultural commodity futures, using the PQM model. First of all, we wish to draw your attention to the main trends in beef/soybean demand and supply.
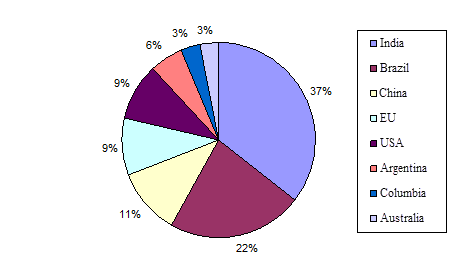
According to the USDA estimates, at the moment the livestock amounts to 1.03 billion. India accounts for 37% of the world livestock (379,7 billion). Among the world cattle breeding leaders we should mention Brazil (208 million), China (104,2 million), the European Union (88 million) and the USA (87.7 million).
|
| The world's cattle stock,% |
India takes the fourth place in beef production rating, and the sixth place in beef consumption. If the religious and cooking preferences of the Hindu change, then there will be a great shortage of cattle meat in the world.. The Indian share in world exports climbed from 5% to more than 20% over the past 10 years. Regarding the US, we should emphasize that the environment permits this country to be the largest meat exporter, and hence improve significantly the world production. The US cattle stock is still close to long-term lows, though it has been increasing over the past four years.
The main peculiar property of soy is considered to be proteins. Protein content in soybeans may reach 40%. Thus, soybeans are commonly used as a cheap substitute of meat, including beef. According to the USDA, global soybean production in 2014/2015 will amount to 300 million tons. The main soybean consumers are the countries in the South-East Asia. Their total share in world exports is 76%, China – 66.2%. We assume that consumers will proceed to change soy meat substitutes for beef, as the Asian and Chinese economies advance . Corresponding changes are possible in the total demand for these products. In turn, this may boost beef prices and lower soybean cost. You can have a look at the main trends in production, consumption, beef and soybean prices for more than 50 years on the charts below.
|
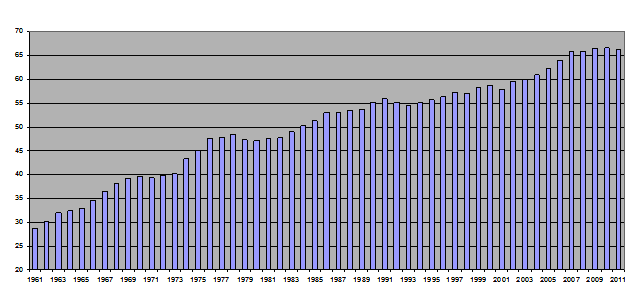
| World beef production, mln. Tons |
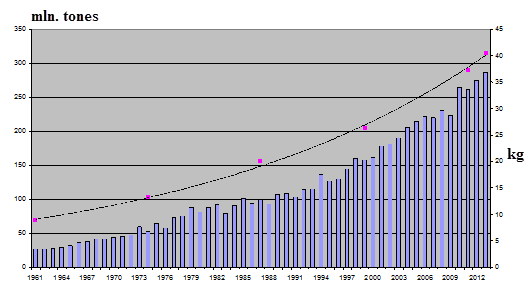
World production of beef and soybean in 1960 was similar: a little less than 30 million tons. Since then the beef meat production has risen by 2.3 times, and soybean – tenfold. The world soy cultivation area increased by 4.4 times to 105 million ha, and its average crop doubled to 23 tons/ha. Amid this data the increased global slaughter of cattle by 70% in 54 years looks unconvincing. Although the number of cows per hectare of cattle grazing gained from 0.23 to 0.32, the number of cows in the world livestock has reduced.
|
| World soybean production, million tons (columns). Soybean consumption per year, kg/person (points, line). |
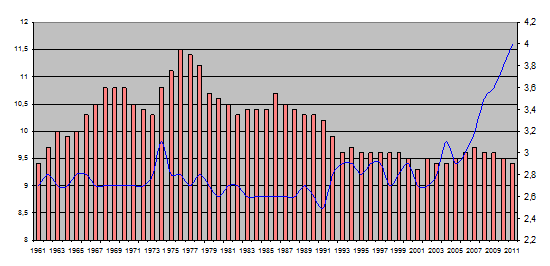
World beef consumption has slipped slightly since the mid-70s amid the rapid poultry development. In fact, it returned to the level of 1960. However, beef consumption in Asian countries is rising very rapidly. Since the early-60s the growth has made up 43%.
|
| Beef consumption, kg per person annually: globally (columns) and South-East Asia (line). |
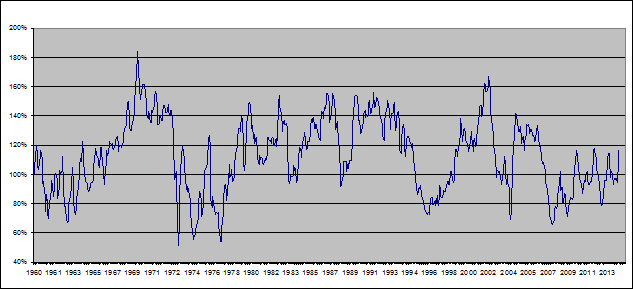
The rising demand for beef in South-East Asia contributes to a substantial price hike of meat in the global market. Since 1960 beef and soybean prices have jumped. Based on the annual prices ($/kg) of beef and soybean, we composed a spread instrument, the value of which is expressed relying on the beef price/soybean price ratio. A relative price value is presented in percentage.
|
| The ratio of 1 kg of beef price ($)/1 kg of soybeans price ($),% |
The chart indicates that the price of this spread has been in the sideways trend for 54 years. This distinctive feature is appropriate for spread instruments based on the interlinked assets. We assume that with the rising beef demand in Asian countries, beef will continue to increase in price, along with the improved welfare of the local residents. Meanwhile, soybean demand reduction is possible to happen, as soy is considered to be a cheaper substitute for meat protein. A further rise in the spread price to the upper boundary of range is expected. The main risk factor for beef remains the increase of cattle livestock in the United States. As for soybeans, the global demand for this product is almost entirely dependent on China, and can tick up only in case of a sudden economy slowdown in China. We witness the first signs of this process at the moment.
Taking the considered fundamental factors into account, we will build a spread trading instrument based on the PCI technology. Let us remind you that PQM model allows composing synthetic instruments: paired spreads, portfolios and composite portfolio spreads. Let us come back to the examination of the simplest case: paired arbitrage trading of two fundamentally linked futures on beef and soybeans. Recall that the contraposition of the two assets is defined on the basis of their price ratio considering the specified volume. Regarding the high connectedness of these instruments, the investor has a possibility to monitor the single composite instrument instead of two elementary instruments. One of the traditional ways to define the level of connectedness is the correlation linear coefficient, or “correlation”, which indicates the linear dependance of the assets' cost change. This coefficient r falls within the range of [-1,1]. Considering negative correlation values, the price growth of the basic asset leads to the price drop of the quoted asset and vice versa: the flat condition becomes unsustainable. Thus, the difference of correlation from the value -100%, i.e. r+1 reveals the possibility of trend moving for a “composite tool”. We consider to be practical the use of arbitrage spread exactly under this condition.
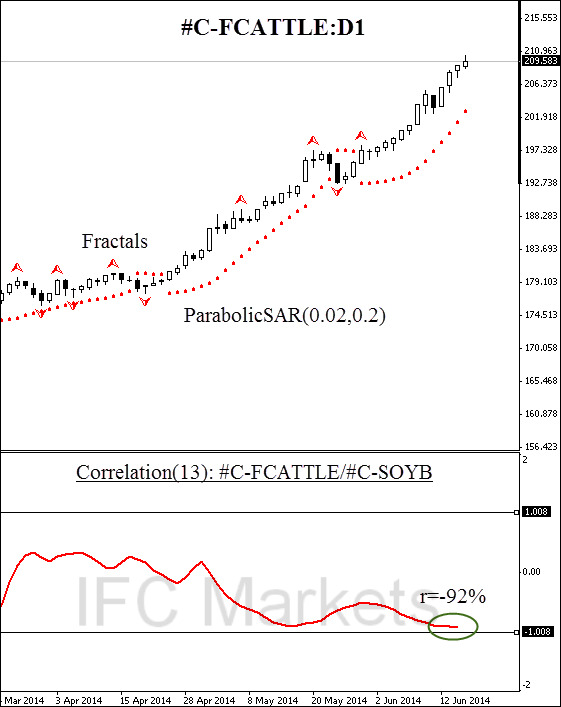
As it was mentioned above, the use of soybean as a meat substitute may suggest an inverse relation between the demand for these products. The hypothesis was tested by means of the IND_Correlation indicator, one of the indicators which allows calculating the correlation coefficient. The indicator is freely available at the MQL5 forum:
www.mql5.com/ru/code/download/9930/
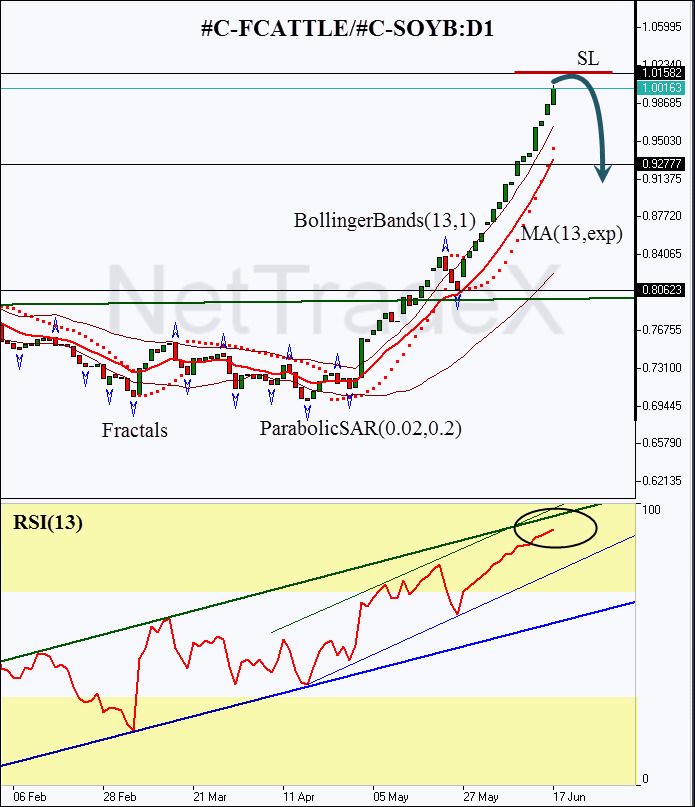
Here we consider the daily chart of the #C-FCATTLE/#C-SOYB, composed on the basis of NetTradeX platform. The divergence of the correlation coefficient into the negative half plane corresponds to 1-5 May: this is exactly the time frame when a new uptrend begins on the PCI daily chart. Correlation may be used as an additional confirmation of the oscillator. At the moment we can observe the RSI oscillator entered the overbought zone and is approaching the limit value of 100%. Meanwhile, the spread price is coming closer to the historical resistance at 1.01582, which will probably be the initial level of the strong retracement onset, taking the oscillator behavior into consideration. We believe that this key level can be used to limit risks, and the position may be opened below 0.92777, this mark intersection will lead to the ParabolicSAR reversal, the moving average breach and the price retrace into the Bollinger channel. Partially the take profit target can be placed near the support at 0.80623. After the position opening, Trailing Stop is recommended to be moved after the ParabolicSAR values every day after the order execution. Thus, we can optimize the risk/reward ratio in our favor in the process of changing market conditions. Note that we selected the 13-day time frame as a statistical horizon of all the indicators: this is the same time frame which was used in the correlation analysis. Thus, we follow the consistency principle of the analysis methods.
Previous articles
- Performance of Japanese stock market versus the US stock market
- Comparing the performance of German stock market versus US stock market
- PCI: Commodity Futures - Coffee vs Cocoa
- PCI on Agricultural Futures: Wheat Futures and Feeder Cattle
- New Corporate Report - Google Stocks, Apple Stocks
- Spread Trading | Stock Trading - Google Stocks, Apple Stocks

