- Education
- Forex Technical Analysis
- Technical Indicators
- Oscillators
- Relative Vigor Index
Relative Vigor Index - RVI Indicator
What is Relative Vigor Index
How to Use RVI Indicator
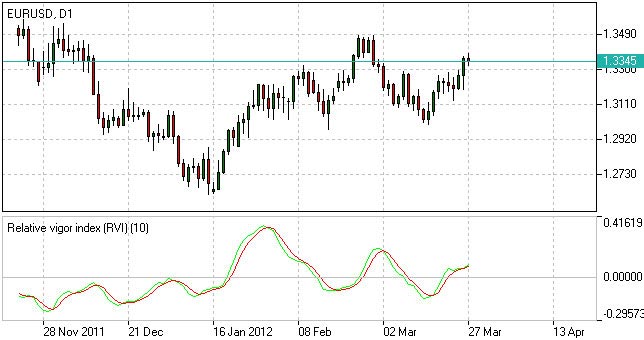
The Relative Vigor Index allows to identify the reinforcement of price changes (and therefore may be used within convergence/divergence patterns analysis):
- Generally the higher the indicator climbs, the stronger is the current relative price increase;
- Generally the lower the indicator falls, the stronger is the current relative price drop.
Together with its signal line (Red), a 4-period moving average of RVI, the indicator (Green) may help to identify changes in prevailing price developments:
- Crossing the signal line from above, the RVI signals a possible sell opportunity;
- Crossing the signal line from below, the RVI signals a possible buy opportunity.

Relative Vigor Index - RVI Indicator
Relative Vigor Index Formula (RVI Calculation)
The Relative Vigor Index indicator is calculated as the actual price change for a certain period divided by the maximum range of price changes in that period. To reduce the dependence on strong price fluctuations, the averaging was applied according to the algorithm of Simple Moving Average with the period of 10.
The Relative Vigor Index formula is as follows:
Relative Vigor Index (1) = (Close - Open) / (High - Low)
Relative Vigor Index (10) = 10-period SMA of Relative Vigor Index (1)
Divergence
An important additional sign of a price reversal using RVI is the divergence between local extremes of price movement and extremes of the indicator movement. Bearish divergence occurs when the price reaches a new low and the local low on the oscillator is higher than the previous one. Conversely, a bullish divergence occurs when price makes a new high and the oscillator high is lower than the previous one. This signal indicates that the price will soon reverse. In our example, we can see that in the vicinity of the date Jan 16, 2012, the price lows are still going down, but the RVI lows are already going up (bearish divergence), which is a signal to buy
How to use Relative Vigor Index in trading platform
Forex Indicators FAQ
What is a Forex Indicator?
Forex technical analysis indicators are regularly used by traders to predict price movements in the Foreign Exchange market and thus increase the likelihood of making money in the Forex market. Forex indicators actually take into account the price and volume of a particular trading instrument for further market forecasting.
What are the Best Technical Indicators?
Technical analysis, which is often included in various trading strategies, cannot be considered separately from technical indicators. Some indicators are rarely used, while others are almost irreplaceable for many traders. We highlighted 5 the most popular technical analysis indicators: Moving average (MA), Exponential moving average (EMA), Stochastic oscillator, Bollinger bands, Moving average convergence divergence (MACD).
How to Use Technical Indicators?
Trading strategies usually require multiple technical analysis indicators to increase forecast accuracy. Lagging technical indicators show past trends, while leading indicators predict upcoming moves. When selecting trading indicators, also consider different types of charting tools, such as volume, momentum, volatility and trend indicators.
Do Indicators Work in Forex?
There are 2 types of indicators: lagging and leading. Lagging indicators base on past movements and market reversals, and are more effective when markets are trending strongly. Leading indicators try to predict the price moves and reversals in the future, they are used commonly in range trading, and since they produce many false signals, they are not suitable for trend trading.
Use indicators after downloading one of the trading platforms, offered by IFC Markets.

Not sure about your Forex skills level?
Take a Test and We Will Help You With The Rest


