- Education
- Introduction to Trading
- How to Trade S&P 500
How to Trade S&P 500
The S&P 500 is one of the most widely followed stock market indexes in the world. It includes the top 500 companies listed on the New York Stock Exchange (NYSE) and the NASDAQ stock market. to Trading the S&P 500 is a lucrative investment opportunity, but it requires a solid understanding of the market and trading strategies.
In this article we are going to talk about how trade the S&P 500, including how to read the S&P 500 price chart and popular S&P 500 trading strategies and risk management. We also explain how to trade the S&P 500, why it can represent such a good profit opportunity, and the most effective tactics that retail traders can use to trade efficiently.
How to trade S&P 500
Before we dive into trading strategies, it's important to understand the basics of the S&P 500 market.
Imagine the S&P 500 as a bustling marketplace, where you can find a diverse array of companies from different sectors, all vying for your attention. From tech giants to healthcare innovators, financial powerhouses to energy leaders, this marketplace has it all.
But, just like in any market, some companies have more sway than others. The S&P 500 takes this into account by giving more weight to the bigger players, kind of like how the most popular vendors in a market tend to attract the most customers.
So, think of the S&P 500 as the pulse of this lively marketplace, reflecting the ebb and flow of the stock market's biggest players.
Ever wondered how economists gauge the health of the US economy?
It's like taking a pulse, but instead of a heartbeat, they look at the performance of the S&P 500. This index is like a barometer for the stock market, giving us a sneak peek into how well the economy is doing.
When the S&P 500 is performing like a champ, it's like fireworks going off - a sign that the economy is thriving and growing. But if the index takes a tumble, it's like the alarm bells ringing, signaling an economic downturn.
Now, if you want to take part in this thrilling game of investing in the S&P 500, you've got options. You could buy and sell shares of ETFs that track the index, or dive deeper and invest in futures and options contracts. It's like being a part of a high-stakes game of chess, where every move counts, and fortunes can be made or lost in the blink of an eye.
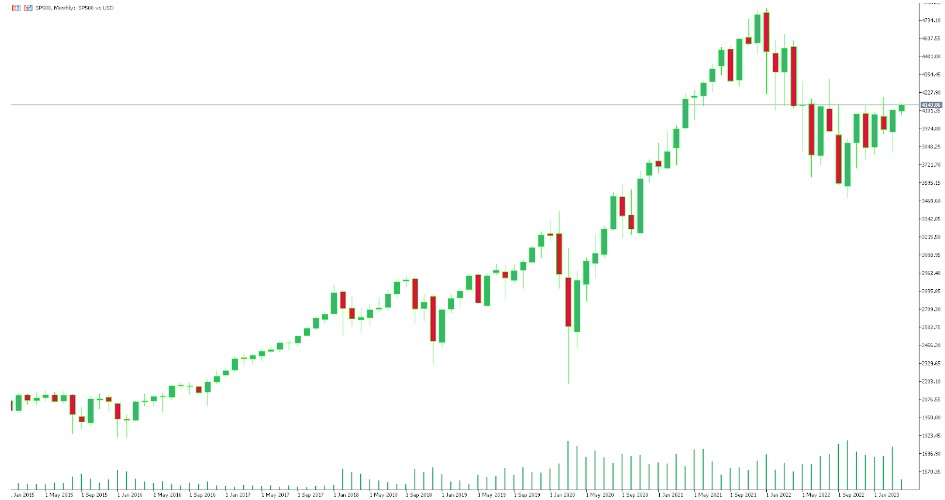
The current value of the index (as of April 2023) is 4101.35 The maximum value was reached in January 2022 and amounted to 4,818.62. This can be clearly seen from the daily candlestick chart below:
You might be wondering where these numbers come from?
In fact, everything is very simple - the S&P 500 is calculated based on the market capitalization of shares in circulation. It represents the 500 largest US companies. Supervision, control and changes of the index is carried out by the index committee.
Well since we have cleared that up, let's move on to the steps you need to follow to trade the S&P 500.
6 Steps on How to trade S&P 500
Here are some steps you can follow to trade the S&P 500:
1. Educate Yourself
Before you start trading, it's important to understand the basics of trading and investing, including the risks involved. You can find a lot of information online, in books or attend webinars, and seminars.
2. Choose a Broker
Find a reputable and reliable broker that offers access to S&P 500. Look for a broker that has low trading fees, a user-friendly platform, and good customer support.
3. Decide on Your Strategy
Determine your investment goals and the type of strategy you want to follow.
- Are you a long-term investor or a short-term trader?
- Do you want to use technical or fundamental analysis to make trading decisions?
Once you have a clear idea of your strategy, you can start developing a trading plan.
4. Open an Account and Fund it
Follow the broker's instructions to open an account, provide your personal information and fund your account. Most brokers offer several funding options, including bank transfer, credit card, or PayPal. IFC Markets, for example, provides these payment methods.
5. Start Trading
Once your account is funded, you can start trading S&P 500 index. Make sure you have a sound trading plan in place, and stick to it. Keep track of your trades and adjust your plan as needed.
6. Manage Risk
Trading the S&P 500 can be volatile, so it's important to manage your risk carefully.
- Use stop-loss orders to cut your losses, and never risk more than you can afford to lose.
- Keep an eye on economic news and events that could affect the market.
- Adjust your trading plan accordingly.
Remember, trading the S&P 500 requires a lot of research, analysis, and discipline. Take the time to study the index and develop a solid trading plan before you start investing your money.
How to Read the S&P 500 Price Chart
Reading the S&P 500 price chart can be a useful tool for understanding the historical performance of the index and identifying potential trends. Here's how to read the chart:
To trade the S&P 500, you'll need to understand how to read the S&P 500 price chart. The S&P 500 price chart shows the historical price movements of the index over time. You can use the price chart to identify trends and patterns in the market.
Here are a few key elements of the S&P 500 price chart:
Time Frame
You can adjust the time frame of the price chart to show different periods of time, such as one day, one week, or one month.
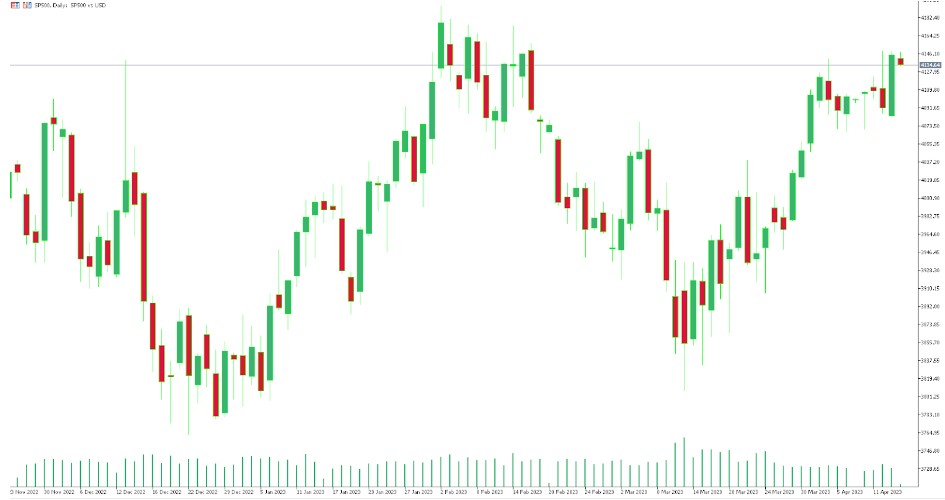
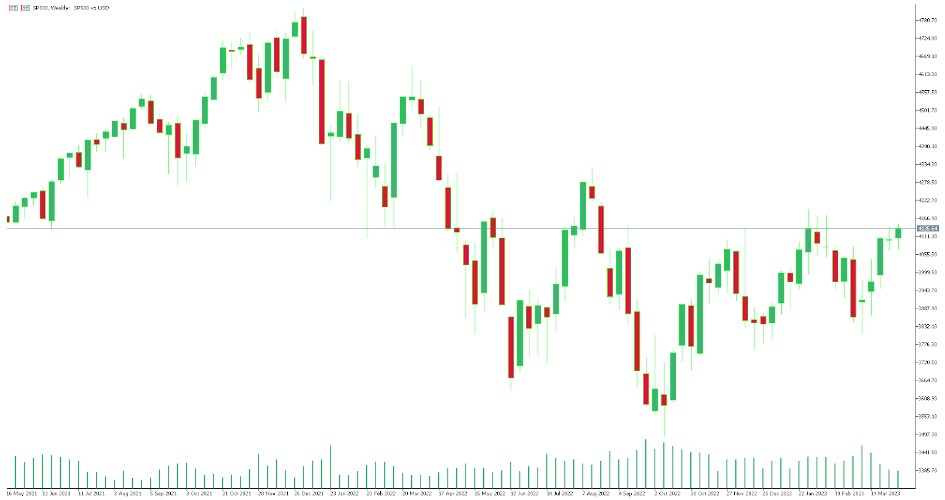
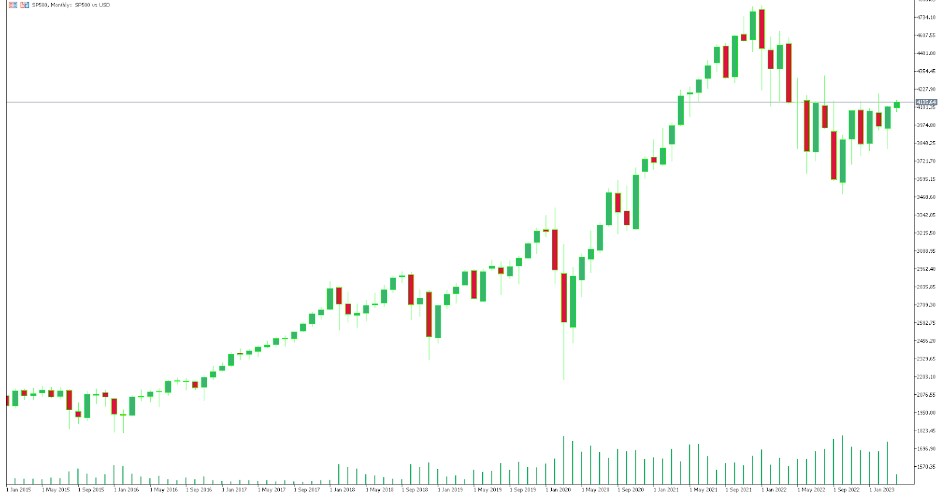
The chart will display a range of dates along the horizontal axis. This will tell you the time frame that the chart is representing. For example, if the chart displays data from January 2015 to April 2023, you'll know that the chart is showing the performance of the S&P 500 index during that time period.
Price Scale
The price scale shows the price movements of the index over time. You can adjust the price scale to show different price ranges, depending on your trading strategy. The vertical axis will show the price of the S&P 500 index. This will tell you the value of the index at any given point in time.
Identify the Trends
Look for patterns in the chart. This can include upward or downward trends, periods of stability, or sudden spikes or drops. Identifying these patterns can help you to understand the historical performance of the index and make informed decisions about future investments.
Technical Indicators
The S&P 500 price chart may include technical indicators, such as Moving Average Indicator or MACD Indicator, which can help identify trends and patterns in the market.
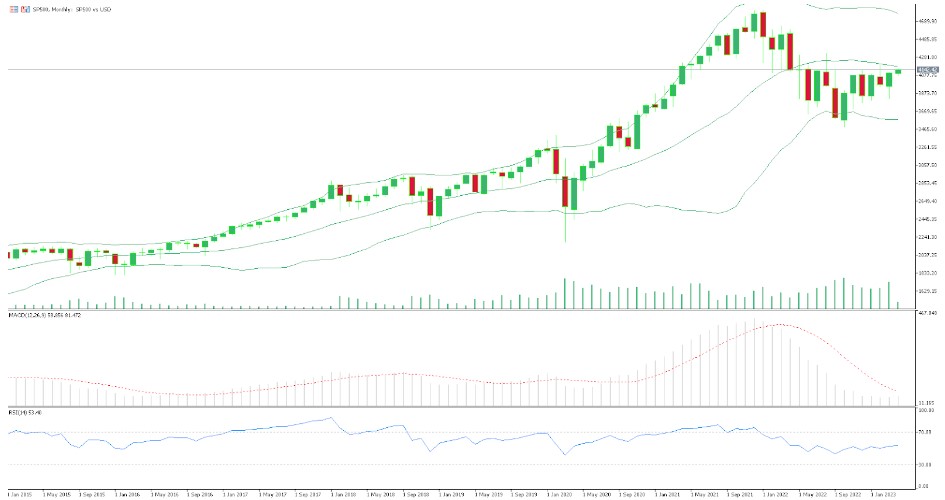
Chart may also include technical analysis tools such as moving averages, Bollinger Bands Indicator, or Relative Strength Index (RSI). These tools can help you to identify potential buy or sell signals based on historical trends.
Consider Other Factors
Keep in mind that other factors can influence the performance of the S&P 500 index, including economic indicators, company earnings reports, and global events. It's important to consider these factors alongside the chart data to make informed investment decisions.
Overall, reading the S&P 500 price chart can be a useful tool for understanding the historical performance of the index and identifying potential trends. By using technical analysis tools and considering other factors, you can make informed investment decisions based on the data provided by the chart.
To trade the S&P 500, you'll need a trading platform. One popular trading platform is MedaTrader 4, which is a free platform.
S&P 500 Trading Strategies
Now that you understand the basics of the S&P 500 market and how to read the price chart, let's take a look at some popular S&P 500 trading strategies.
- Technical analysis: Technical analysis involves studying past market data to identify trends and patterns that can help predict future price movements. This can include using technical indicators, such as moving averages or MACD, to identify buy and sell signals.
- Fundamental analysis: Fundamental analysis involves studying financial statements, company news, and other data to determine the intrinsic value of a company. By understanding the underlying companies in the index, you can make informed trading decisions.
- News trading: News trading involves trading based on the release of economic data or other news events that could impact the market. For example, if a positive jobs report is released, it could be a sign that the economy is growing, which could cause the S&P 500 to rise. Traders who use news trading strategies typically have a fast reaction time and are able to quickly enter and exit positions based on breaking news.
- Swing trading: Swing trading involves holding positions for a few days to a few weeks, with the goal of profiting from short-term price movements. This can involve using technical analysis to identify trends and patterns in the market, and then entering and exiting positions based on those trends.
- Day trading: Day trading involves entering and exiting positions within the same day. Day traders typically use technical analysis to identify short-term price movements and then enter and exit positions based on those movements.
Example
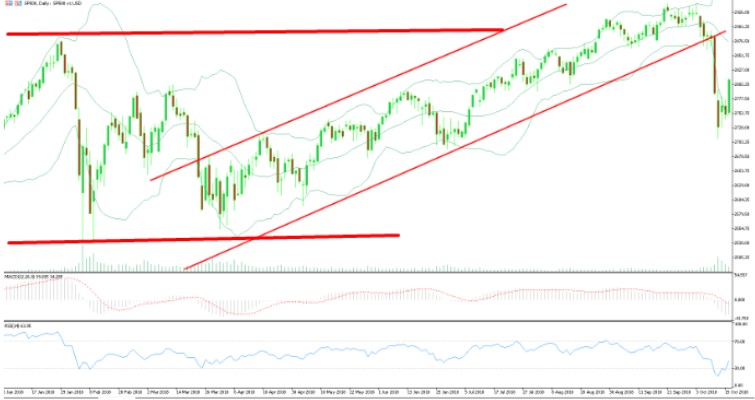
An effective S&P 500 trading strategy involves utilizing various technical indicators, such as price action, oscillators, support and resistance levels, trend channels, moving averages, and triangle price patterns. The graph below illustrates an S&P chart with support and resistance levels and a trend channel, which are only a few examples of the many indicators you can use in your strategy.
To increase the likelihood of success, you may seek buy signals that align with the current market trend. For instance, if the S&P has been trending upwards, you would be considering buying at support levels (the bottom red line). Conversely, if the market has been trending downwards, you'd be looking to sell at resistance levels (the top red line).
But remember - no trading strategy is bulletproof. The market can be unpredictable, and even the most experienced traders can experience losses. It's important to have a solid risk management plan in place to minimize potential losses.
Bottom Line on How to Trade S&P 500
Trading the S&P 500 can be a profitable investment opportunity for those with a solid understanding of the market and trading strategies. To get started, it's important to understand how to read the S&P 500 price chart, and how to use a trading platform like MT4 and, of course, having well written trading strategy with risk management.
Good Luck!

