- Education
- Forex Trading Strategies
- Strategies by Forex Analysis
- Technical Analysis Strategy
- Chart Pattern Trading Strategy
Chart Pattern Trading Strategy - Chart Patterns in Forex
KEY TAKEAWAYS
- There are several trading methods, each of which uses price patterns to find entry points and stop levels
- One limitation shared across many technical patterns is that it can be unreliable in illiquid stocks
- Traders often use chart patterns as a Forex strategy.
Forex Chart Pattern Strategy
Traders often use chart patterns as a Forex strategy.
Forex market has a behavior that shows patterns. Chart patterns usually occur during change of trends or when trends start to form. There are known patterns like head and shoulder patterns, triangles patterns, engulfing patterns, and more. Let us introduce to you some of them, it will help you identify the trend of the market and trade accordingly.
Chart Patterns in Forex
There are several trading methods, each of which uses price patterns to find entry points and stop levels (you can read more about trading in our article " What is Forex trading and how does it work"). Forex charting patterns include head and shoulders as well as triangles, which provide entries, stops and profit targets in a form that can be easily seen.
Head and Shoulders (H&S) chart pattern is quite popular and easy-to-spot in technical analysis. Pattern shows a baseline with three peaks where the middle peak is the highest, slightly smaller peaks on either side of it. Traders use head and shoulders patterns to predict a bullish and bearish movement.
Head and shoulders shaping is distinctive, chart pattern provides important and easily visible levels - Left shoulder, Head, Right shoulder. Head and shoulders pattern can also be inverse and will look like this and the pattern is called Inverse Head and Shoulders.
- Triangles fall under continuation patterns category, there are three different types them:
- Ascending triangle - The ascending triangle pattern in an uptrend, easy to recognize but is also quite an easy entry or exit signal.
- Descending triangle - The Descending triangle is noticable fot its downtrends and is often thought of as a bearish signal.
- Symmetrical triangle - Symmetrical triangles, as continuation patterns developed in markets, are aimless in direction. The market seems apathetic in its direction. The supply and demand, therefore, seem to be one and the same.
At the start of its formation, the triangle is at its widest point, as the market continues to trade, the range of trading narrows and the point of the triangle is formed. Because the triangle narrows it means that both buy and sell sides interest is decreasing - the supply line diminishes to meet the demand.
Chart Patterns Trading
Chart patterns are widely used in trading while conducting technical analysis. Studying these patterns will be useful for building or using as a trading strategy.
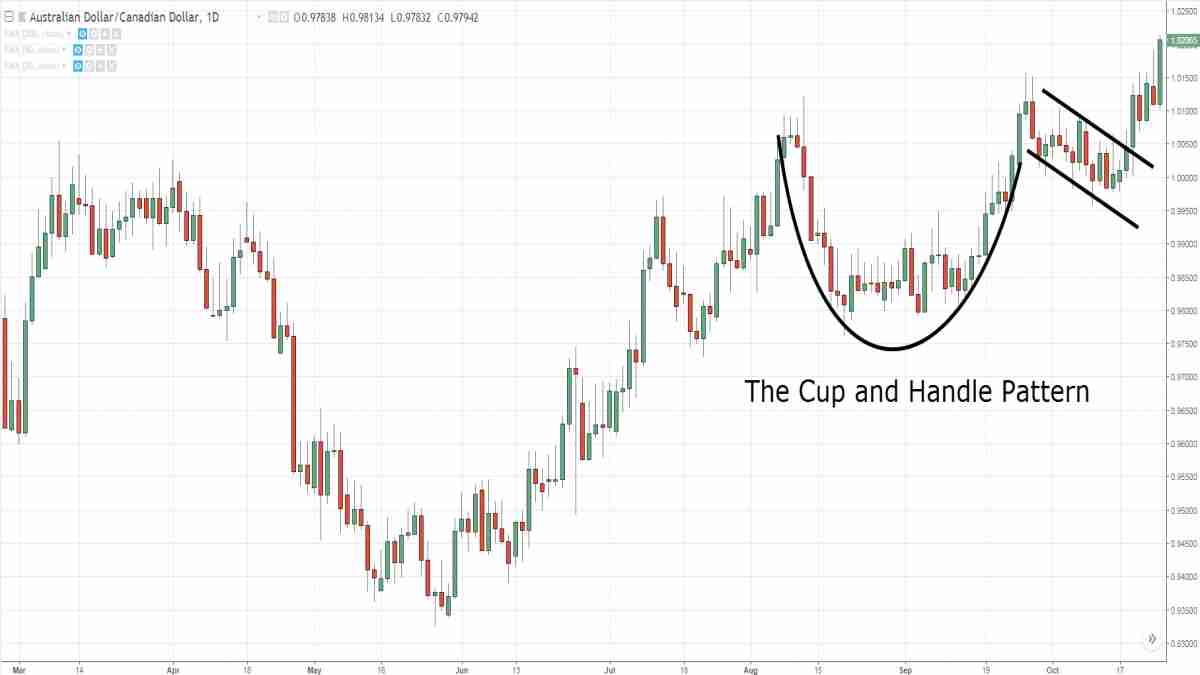
Cup and Handle A cup and handle is a technical chart pattern that resembles a cup and handle where the cup is in the shape of a "u" and the handle has a slight downward drift. Looks like this:
It is worth paying attention to the following when detecting cup and handle patterns:
- Length: Generally, cups with longer and more "U" shaped bottoms provide a stronger signal. Avoid cups with sharp "V" bottoms.
- Depth: Ideally, the cup should not be overly deep. Avoid handles that are overly deep also, as handles should form in the top half of the cup pattern.
- Volume: Volume should decrease as prices decline and remain lower than average in the base of the bowl; it should then increase when the stock begins to make its move higher, back up to test the previous high.
Flag is a price pattern that moves in a shorter time frame against the prevailing price trend observed in a longer time frame on a price chart. Reminds the trader of the flag, hence the name. Flag patterns can be upward trending (bullish flag) or downward trending (bearish flag).
Note: Flag may seem similar to a wedge pattern or a triangle pattern, it is important to note that wedges are narrower than pennants or triangles.
- The preceding trend
- The consolidation channel
- The volume pattern
- A breakout
- A confirmation where price moves in the same direction as the breakout
- Wedges form as an asset’s price movements tighten between two sloping trend lines. There are two types of wedge: rising and falling.
- The converging trend lines;
- Pattern of declining volume as the price progresses through the pattern;
- Breakout from one of the trend lines.
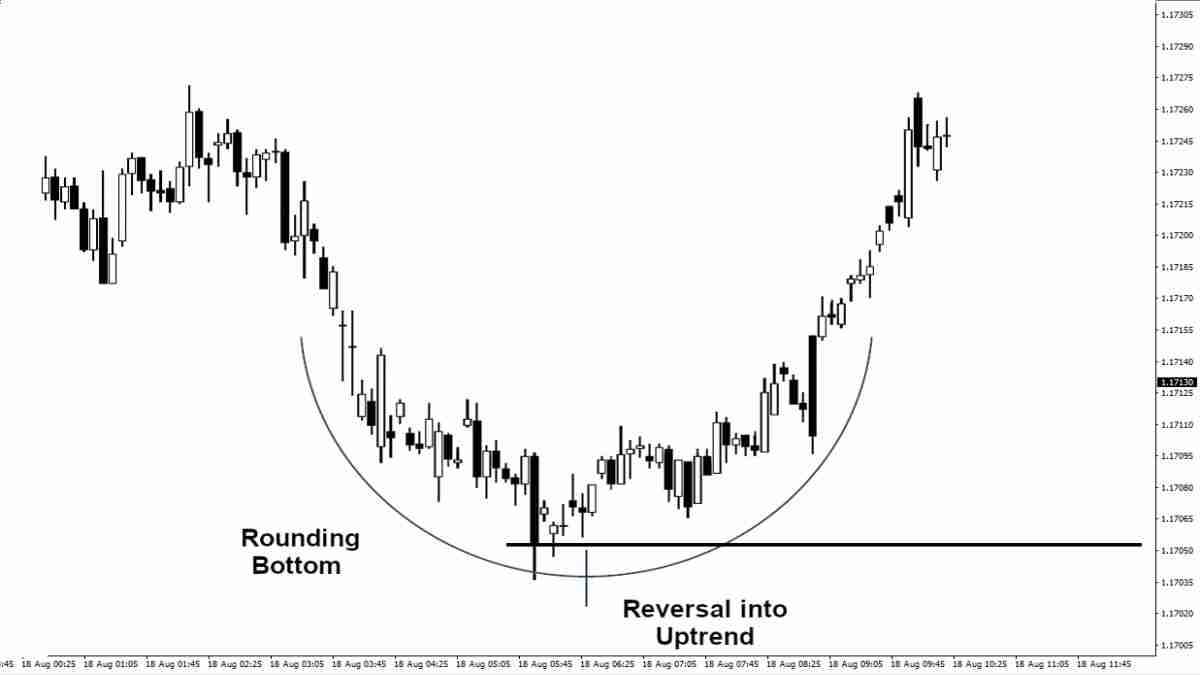
- Rounding bottom Chart pattern is identified by a series of price movements that graphically form the shape of a "U". Rounding bottoms are found at the end of long downward trends and signify a reversal in long-term price movements. It could take from several weeks to several months and it happens quite rarely.
- Double top is a bearish technical reversal pattern. Traders use double top to highlight trend reversals. Typically, an asset’s price will experience a peak, before retracing back to a level of support. It will then climb up once more before reversing back more permanently against the prevailing trend.
Double bottom patterns are the opposite of double top patterns. Double bottom patterns if identified correctly are highly effective. Therefore, one must be extremely careful before jumping to conclusions.
The double bottom looks like the letter "W". The twice-touched low is considered a support level.
Flag patterns have five main characteristics:
Wedge patterns are usually characterized by converging trend lines over 10 to 50 trading periods, which ensures a good track record for forecasting price reversals. A wedge pattern can signal bullish or bearish price reversals. In either case, this pattern holds three common characteristics:
The two forms of the wedge pattern are a rising wedge, which signals a bearish reversal or a falling wedge, which signals a bullish reversal.
Bottom line on Chart Pattern Trading Strategy
All of the patterns are useful technical indicators which can help traders to understand how or why an asset’s price moved in a certain way – and which way it might move in the future. This is because chart patterns can highlight areas of support and resistance, the latest in turn can help a trader decide whether they should open a long or short position; or whether they should close their open positions in the event of a possible trend reversal.


