- تحليلات
- التحليل الفني للسوق
USD/ZAR التحليل الفني - USD/ZAR التداول: 2021-01-07
USD/ZAR ملخص التحليل الفني
أعلى من 15.15
Buy Stop
أقل من 14.45
Stop Loss
| مؤشر | الإشارة |
| RSI | محايد |
| MACD | شراء |
| MA(200) | محايد |
| Fractals | محايد |
| Parabolic SAR | شراء |
| Bollinger Bands | محايد |
USD/ZAR تحليل الرسم البياني
USD/ZAR التحليل الفني
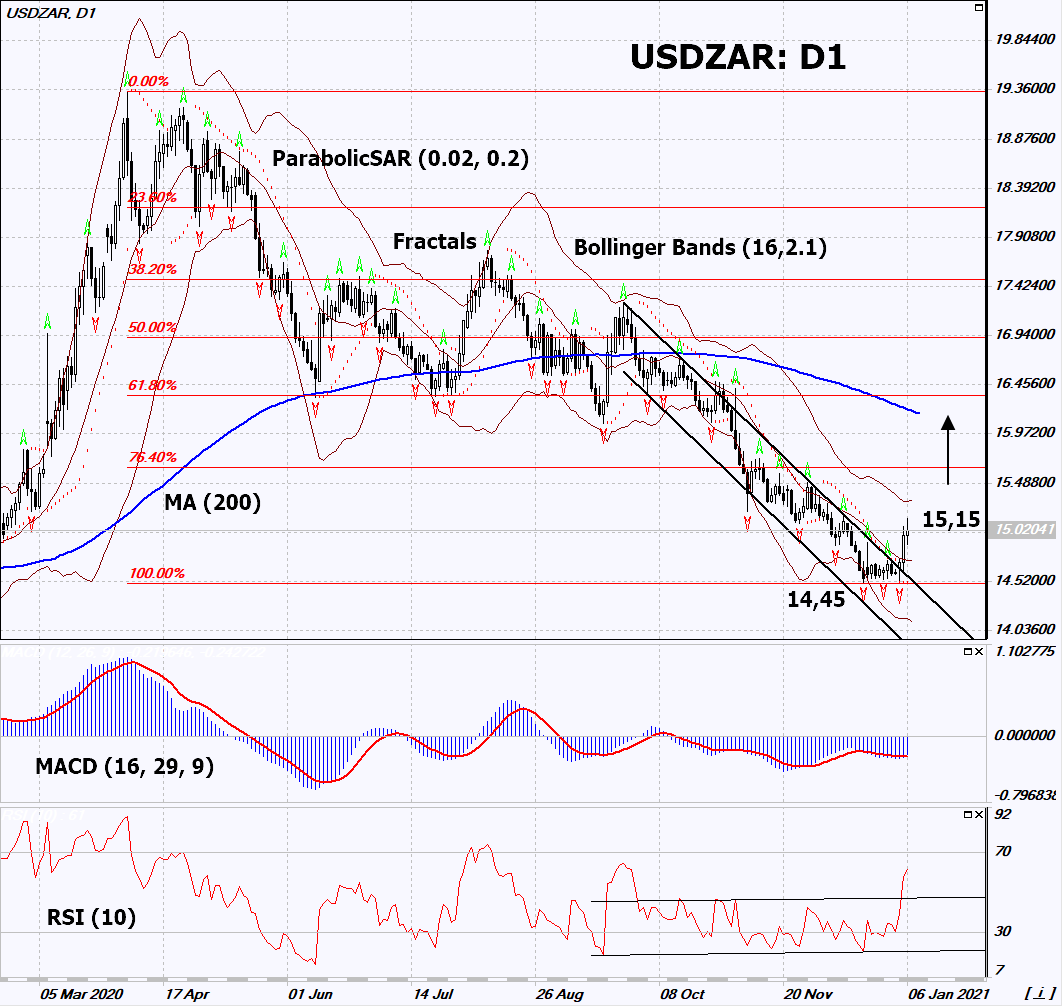
On the daily timeframe, USDZAR: D1 moved up from the descending channel. A number of technical analysis indicators formed signals for further growth. We do not rule out a bullish move if USDZAR rises above its latest high: 15.15. This level can be used as an entry point. We can place a stop loss below the Parabolic signal, the last three lower fractals and the annual low: 14.45. After opening a pending order, we move the stop loss to the next fractal low following the Bollinger and Parabolic signals. Thus, we change the potential profit/loss ratio in our favor. After the transaction, the most risk-averse traders can switch to the four-hour chart and set a stop loss, moving it in the direction of the bias. If the price meets the stop loss (14.45) without activating the order (15.15), it is recommended to delete the order: the market sustains internal changes that have not been taken into account.
التحليل الأساسي لـ الفوركس - USD/ZAR
In the Republic of South Africa (RSA), the number of patients with coronavirus has increased. Will the USDZAR quotes grow ?
An upward movement signifies a weakening of the South African rand against the US dollar. At the end of December, a new mutation of the coronavirus - SARS-CoV-2 (501.V2) was discovered in South Africa. Current vaccines are likely to be ineffective against it. They are now being tested. Meanwhile, the number of people with Covid-19 in South Africa began to increase sharply and has already reached 15 thousand people a day. In early December there were about 4 thousand a day. In total, 1.12 million people fell ill in South Africa and 30.5 thousand died. International rating agencies Fitch and Moody's downgraded South Africa's ratings to a speculative level at the end of November 2020, and S&P did it even earlier.
استكشف
شروط التداول لدينا
- فروق الأسعار من 0.0 نقطة
- أكثر من 30,000 أداة تداول
- مستوى التوقف (الستوب أوت) - 10% فقط
هل أنت مستعد للتداول؟
فتح حساب :تنبيه
يحمل هذا الموجز طابعاً إعلامياً و تعليمياً و تنشر بالمجان . تأتي معظم البيانات المدرجة في الموجز من المصادر العامة معترفة أكثر و أقل موثوقية . مع ذلك ، لا يوجد تأكيد على أن المعلومات المشارة إليها كاملة و دقيقة . لا يتم تحديث الموجز . معظم المعلومات في كل موجز ، تتضمن الرأي و المؤشرات و الرسوم البيانية و أي شيئ اخر وتقدم فقط لأغراض التعريف وليس المشورة المالية أو توصية . لا يمكن اعتبار النص باكماله أو أي جزء منه و أيضاً الرسوم البيانية كعرض لقيام بصفقة بأي اداة . آي إف سي ماركيتس وموظفيها ليست مسؤولة تحت أي ظرف من الظروف عن أي إجراء يتم اتخاذه من قبل شخص آخر أثناء أو بعد قراءة نظرة عامة .

